
|
|
|
|
| GraphMath App for iPhone and iPad |
|
Detailed Description: |
|
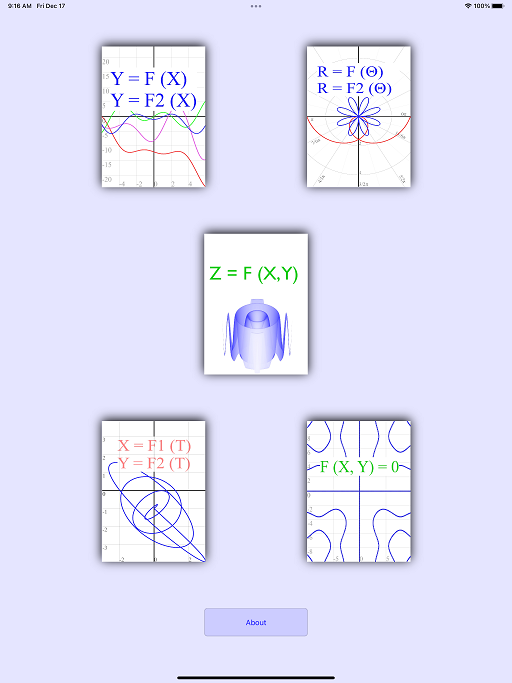
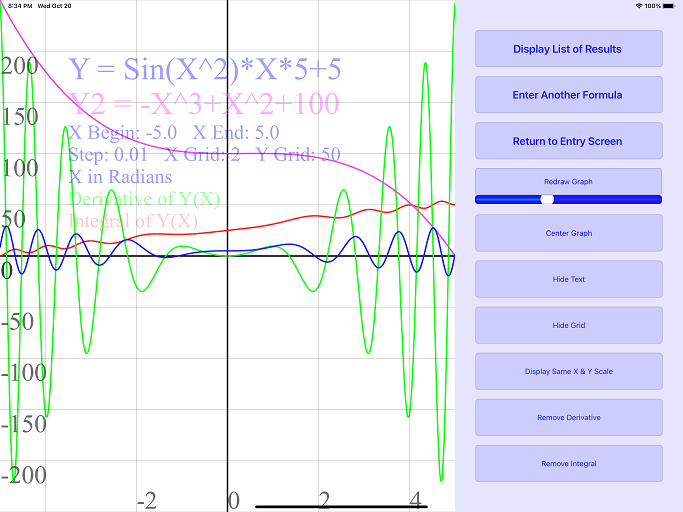
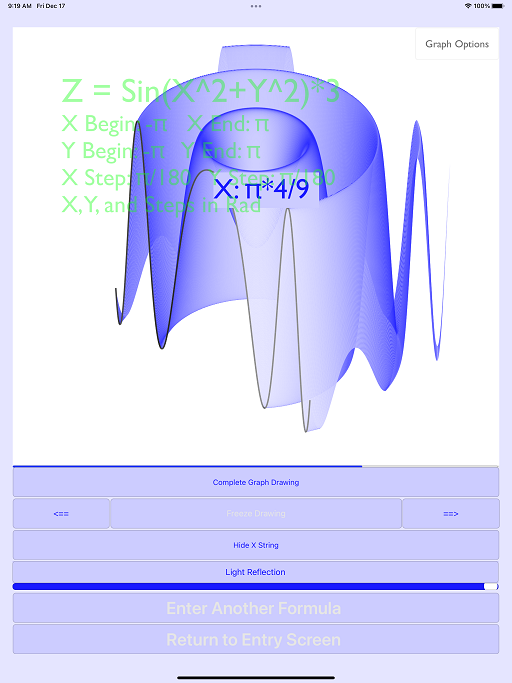
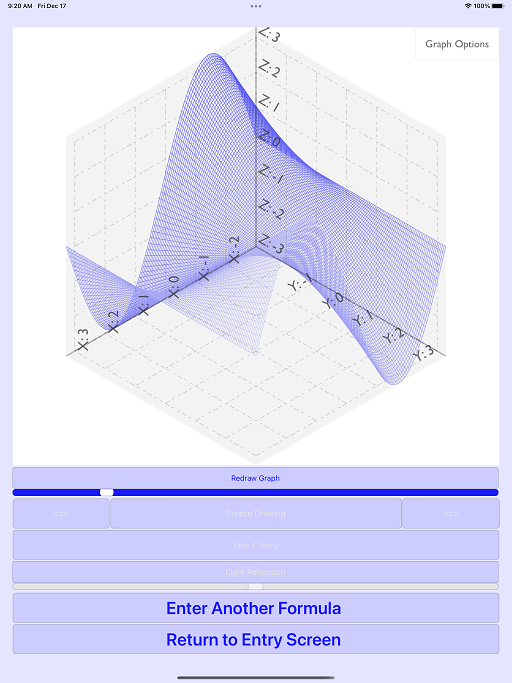
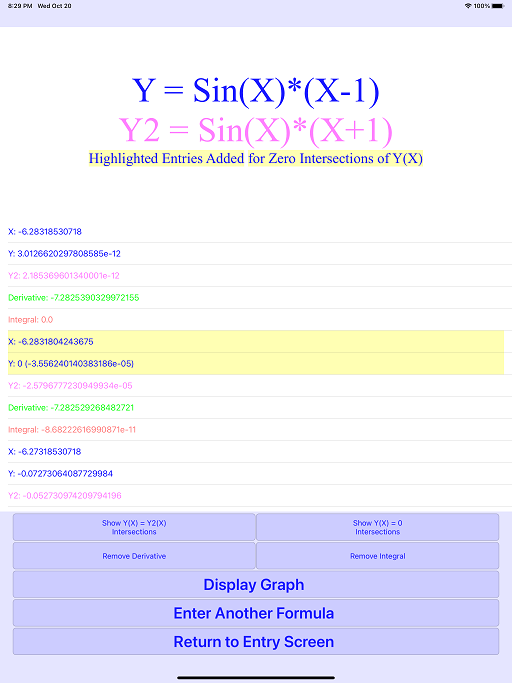
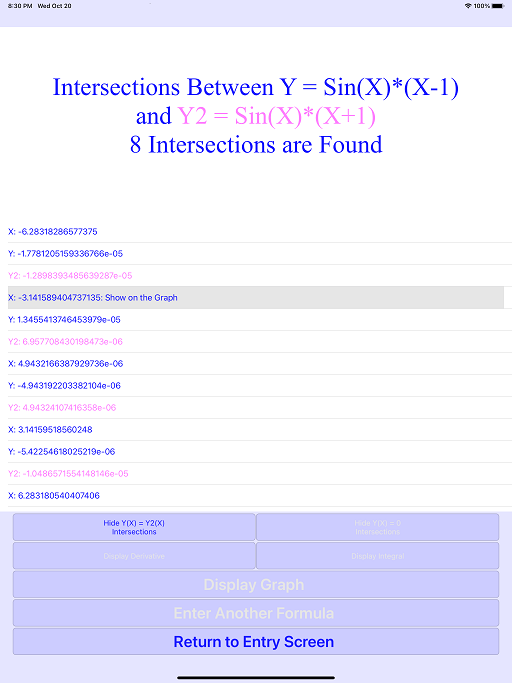
Cartesian 2D Y = F (X) functions: Graph displays the following curves: 1. One or two Y = F(X) functions. 2. Derivative of the first function. 3. Integral of the first function as a shade and a curve. Graph features: 1. Drawing is animated by X. 2. Clicking on the curves shows curve values, and finds closest point in the table. Tables: 1. All function, integral, and derivative values. 2. Zero intersections of first function. 3. Intersections between first and second functions. Polar 2D R = F(Θ) functions: Graph displays the following curves: 1. One or two R = F(Θ) functions. 2. Integral of the first function as a shade and a curve. Graph features: 1. Drawing is animated by Θ. 2. Clicking on the curves shows curve values, and finds closest point in the table. Tables: 1. Table of all function and integral values. 2. Table of zero intersections of first function. 3. Table of intersections between first and second functions. Parametric 2D X(T), Y(T) functions: Graph features: 1. Drawing is animated by T. 2. Clicking on the curves shows T, X, and Y values, and finds them in the table. Table of all points. F (X, Y) = 0 equations: Graph displays solutions as points. Clicking on the points shows X, and Y values, and finds them in the table. Table of all points. Cartesian 3D Z = F(X, Y) functions: Graphs can be: 1. Drawn as surface, lines, or dots. 2. Drawn with or without perspective, and with different light settings. 3. Tilted up or down. 4. Rotated around X, Y, or Z axis. 5. Drawing is animated by either X or Y. Table of all points can be sorted by either X or Y. Cylindrical 3D Z = F(Θ, R) functions: Graphs can be: 1. Drawn as surface, lines, or dots. 2. Drawn with or without perspective, and with different light settings. 3. Tilted up or down. 4. Rotated around Z axis or Θ = 0 axis. 5. Drawing is animated by Θ, R, or Z. Table of all points can be sorted by either Θ or R. Spherical 3D R = F(Θ, Φ) functions: Graphs can be: 1. Drawn as surface, lines, or dots. 2. Drawn with or without perspective, and with different light settings. 3. Tilted up or down. 4. Rotated around Z axis or Θ = 0 Φ = 90 axis. 5. Drawing is animated by either Θ or Φ. Table of all points can be sorted by Θ, Φ, or R Common features: 1. List of previous entries. 2. List of preset entries. 3. Undo and redo buttons for formula entries. 4. Automatic correction of errors in function limits or steps are offered. 5. All function points can be saved to clipboard in a table format. 6. All function points can be displayed on corresponding graphs. Common features of all images: 1. Animation frames can be frozen and moved back or forward. 2. Animation speed can be adjusted. 3. Zoom. 4. Scroll. 5. Save to Clipboard. 6. Color picker. More functions and UI improvements are coming! |
|
Here are some examples (click to see the full size picture): |
||||
|---|---|---|---|---|
| | ||||
|

|
|
||
| Entry Screen | y=f(x),f'(x),S(x) | y=f(x),f'(x),S(x) | ||
| | ||||

|
|
|
||
| z=f(x,y) | z=f(x,y) | z=f(x,y) | ||
| | ||||
|

|

|
|

|
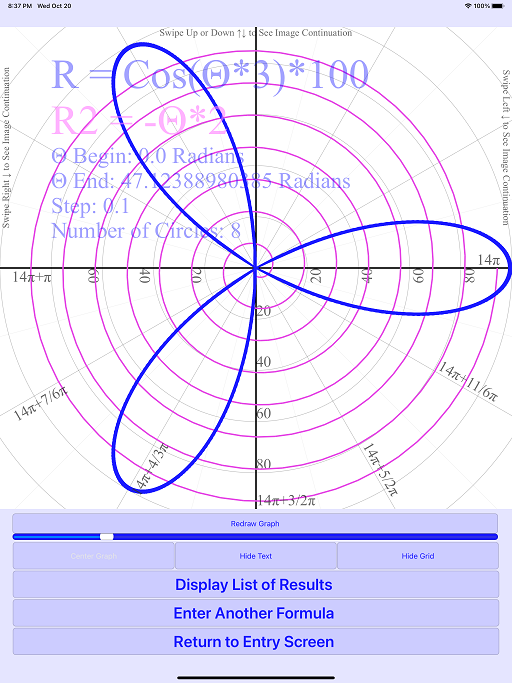
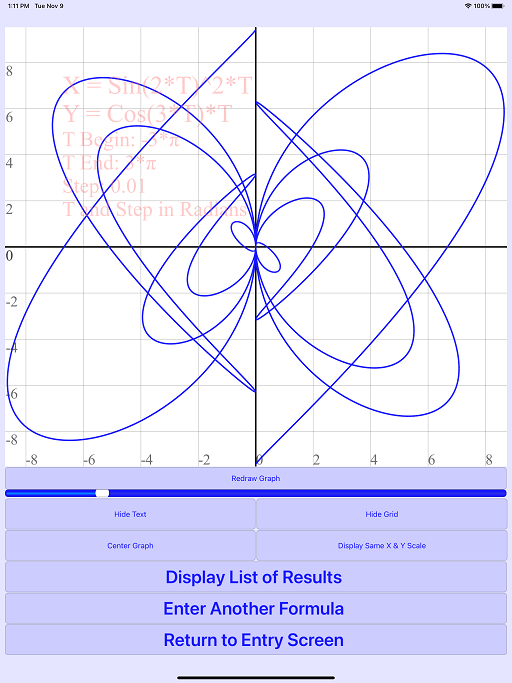
| r=f(Θ),polar | r=f(Θ),polar | x=f(t),y=f(t) | x=f(t),y=f(t) | x=f(t),y=f(t) |
| | ||||
|
|
|
|
|
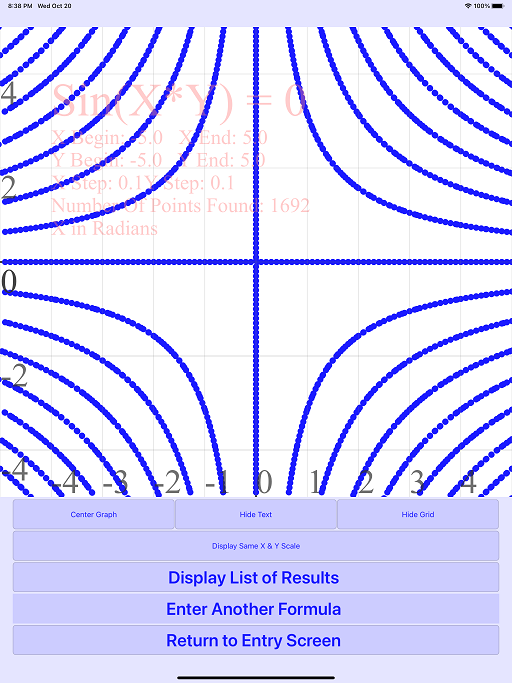
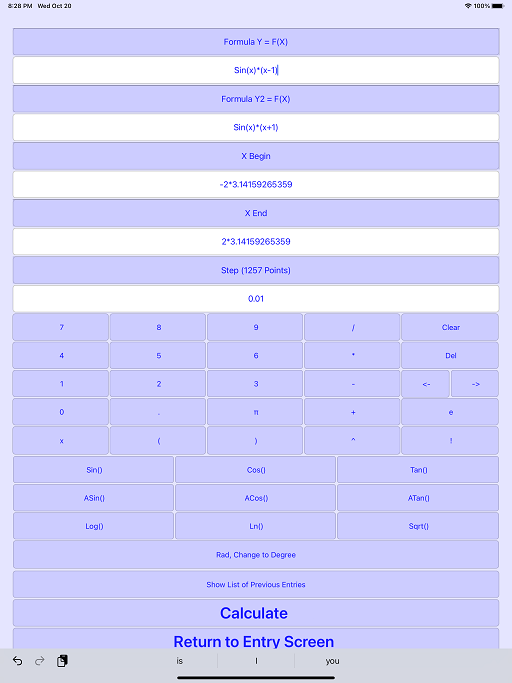
| f(x,y)=0 | Data Entry | Data Table | Data Table | |
| | ||||
|
To download this free app from Apple AppStore, please click here (ver. 8.0, last updated 05/17/2022) |
| The authors would like to hear your suggestions or comments. | |
| Write to us! (GraphMath@aol.com) | |